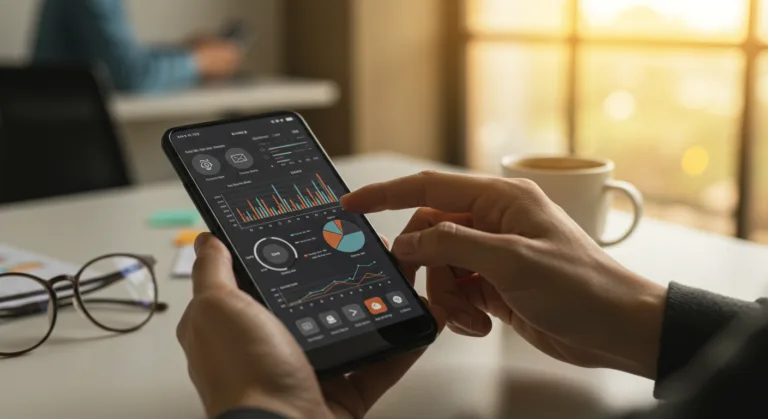
If you’re in an industrial business, you can’t compete flying blind. You need to know what’s happening with your physical assets, from machinery on the factory floor to equipment out in the field, right now. Waiting for a report is too slow. Combining artificial intelligence with mobile devices gives you a direct line of sight: mobile AI dashboards. These tools give decision-makers true asset visibility. Instead of just a flood of raw data, you get actual intelligence that tells you when to perform maintenance, how to allocate resources, and how to keep things running smoothly. So, how do you actually get these things built and working to give you a real advantage?
Key Takeaways
- Before you look at any software, figure out what you absolutely need to track in real time, like OEE or energy use.
- Pull data from all your different systems (SCADA, IoT sensors, etc.) using APIs to get a single, clean view in your mobile dashboard.
- Set up AI-powered alerts for weird behavior and predictive maintenance, and make sure those alerts go straight to the right person’s phone.
- Focus on the user experience. A dashboard needs to be dead simple to use, with customizable views for different roles.
- Don’t just launch it and walk away. Constantly get feedback from users and tweak the dashboards as your operations change.
1. Define Your Critical Asset Visibility Requirements
Forget about technology for a minute. The first step is to get a crystal-clear picture of what you need to see and why. This means talking to people and mapping out your processes. Start by listing your most valuable assets, the machines, vehicles, or infrastructure that would cripple your operation if they failed. For a plant in Detroit, that’s probably the robotic welding arms. For a utility in rural Georgia, it might be the substation transformers. Then, what data from those assets actually matters? Go beyond just uptime. You should be thinking about metrics like Overall Equipment Effectiveness (OEE), mean time between failures (MTBF), energy consumption, temperature, and vibration. Every single metric has to connect to a business goal, like cutting maintenance costs by 15% or boosting throughput by 10%. I’ve seen countless projects go off the rails because they picked a cool technology first and then tried to find a problem to solve with it. That’s backward.
Pro Tip: Get maintenance techs, ops managers, and even people from finance in a room during this discovery phase. They all have different pain points and will point out critical data needs you would’ve missed. Write all this down in a spec sheet that details where the data will come from, how often it needs to refresh, and what action someone is supposed to take based on that data point.
Common Mistake: Trying to show everything. The temptation is to cram every possible data point onto the dashboard, which just creates a noisy mess where nobody can find anything useful. Focus on the handful of key performance indicators (KPIs) that people can actually act on.
2. Consolidate and Standardize Data Sources
Let’s be honest: industrial data is usually a mess. It’s fragmented across dozens of systems. You’ve got Supervisory Control and Data Acquisition (SCADA) systems running the factory, Enterprise Resource Planning (ERP) systems tracking inventory, and a whole bunch of Internet of Things (IoT) sensors sending back telemetry. To get a useful mobile AI dashboard, you have to bring all these streams together in a data lake or warehouse. This means building out APIs or using connectors to pull data from things like Siemens TIA Portal for your PLC data or SAP for asset management info. Just as important is standardizing the data. Make sure everyone is using the same units, naming conventions, and formats. If one sensor reports temperature in Celsius and another uses Fahrenheit, you have to convert them to a single standard before they even hit your system. It’s a lot of work, but according to an Accenture report, companies that get this right see about a 15% jump in operational efficiency. This isn’t just a technical exercise. It’s a strategic one that breaks down the data silos that keep you from seeing the full picture.
Pro Tip: Set up a master data management (MDM) strategy for your asset data. This creates a single source of truth for asset IDs, specs, and hierarchies, which prevents a ton of downstream headaches and cleans up your data quality across the board.
Common Mistake: Ignoring bad data at the source. If the data coming into your pipeline is garbage, your AI dashboard will spit out garbage insights. Fix data quality problems where they start, not after the fact.
3. Select an AI-Powered Mobile Dashboard Platform
The market for industrial apps is crowded now, so picking the right platform is everything. Your choice here will determine how flexible and scalable your dashboards are, and what kind of AI you can actually use. You’ll want a platform with native app support for both iOS and Android so your field teams can actually use it. Look for real-time data streaming, good visualization tools, and built-in AI/Machine Learning modules. Some solid options like Tableau Embedded Analytics or Microsoft Power BI Mobile can work great, provided you have a strong data engineering team on the backend. When evaluating platforms, ask vendors for specific industrial case studies. How does their AI detect anomalies or predict maintenance on equipment like yours? How hard is it to customize? The goal here is getting intelligent alerts and prescriptive actions, not just slick-looking charts.
Pro Tip: Make sure the platform has great API documentation and is developer-friendly. You will inevitably need to build custom integrations for some of your specialized or proprietary equipment that an off-the-shelf connector won’t cover.
Common Mistake: Buying a generic business intelligence (BI) tool. A general-purpose BI tool might make some nice graphs, but it usually won’t have the specific connectors, real-time processing horsepower, or built-in AI models you need for real operational asset visibility in an industrial setting.
4. Design Intuitive Mobile Dashboards for Different User Roles
You can’t have a one-size-fits-all dashboard. A factory supervisor, a C-suite executive, and a field technician all need to see completely different things. The supervisor’s dashboard should be focused on real-time OEE, line status, and immediate fault alerts, probably with big, color-coded indicators for quick glances. The field tech’s ruggedized tablet needs to show them an asset’s GPS location, its maintenance history, and maybe even an augmented reality overlay pointing out the exact component that needs fixing. The executive, on the other hand, needs a high-level view of asset performance across the entire company, focusing on financial impact and long-term trends. Use your platform’s tools to build these role-based views. In Power BI Mobile, for instance, you can create different pages in a report for specific user groups. This way, everyone sees exactly what they need to make a decision, and nothing more.
Pro Tip: Do user acceptance testing (UAT) with actual people from each role. Give them the device and watch them use the dashboard. You’ll learn more from watching where they get stuck and what they complain about than you will in weeks of planning meetings. A dashboard is only good if people actually use it.
Common Mistake: Making it too complicated. You have very little screen space on a phone. Don’t try to cram every widget you can think of onto one screen. Keep it clean and simple, and use drill-down functions to let users explore details if they need to.
5. Implement AI-Driven Anomaly Detection and Predictive Maintenance
This is where the AI in mobile AI dashboards really earns its keep. Once your data is flowing cleanly and consistently, you can set the platform’s machine learning modules loose on it. For example, you can train a model to learn the normal operating signature of a compressor, its typical temperature, pressure, and vibration patterns. When the live sensor data starts to drift from that learned baseline, even in subtle ways across multiple variables, the AI triggers an alert. This is far more powerful than just setting a static “too hot” threshold. Then there’s predictive maintenance, which uses historical data to forecast failures before they happen. A 2023 McKinsey & Company study found that this approach can cut equipment downtime by 10 to 20 percent and reduce maintenance costs by 5 to 10 percent. You can configure these AI-generated alerts to go directly to a technician’s phone with all the context they need. Imagine a notification popping up: “Bearing 3 on Pump A (Asset ID: 45678) in Atlanta facility showing elevated vibration, 85% probability of failure in next 72 hours. Recommended action: schedule inspection.” This lets you shift from frantic, reactive repairs to planned, strategic interventions.
Pro Tip: Keep feeding new data back into your AI models. They get smarter over time. By regularly retraining your models with the latest performance and failure data, you make their predictions more and more accurate.
Common Mistake: Thinking AI is a “set it and forget it” tool. AI models drift. They need constant monitoring and retraining to stay sharp, otherwise their predictions will get stale as your equipment and operating conditions change.
6. Secure Mobile Access and Data Privacy
Putting real-time operational data onto mobile devices is inherently risky, so you have to lock it down tight. Multi-factor authentication (MFA) is non-negotiable for anyone accessing these dashboards. All data needs to be encrypted both in transit and on the device itself, using secure VPNs or an enterprise mobility management (EMM) platform. You also have to be paranoid about data privacy, especially with proprietary process information. Make sure you’re complying with all industry regulations and your own security policies. This usually means setting up granular access controls so users can only see the data for their specific job. A field tech should be able to see the status of the equipment they’re working on, but they shouldn’t see the financial performance of the entire plant. Run regular security audits and penetration tests on the whole system. The convenience of mobile access can’t come at the cost of security, because a breach could impact your physical operations, not just your data.
Pro Tip: Use an EMM or Mobile Device Management (MDM) solution to enforce device-level security. This gives you the power to remotely wipe a lost or stolen phone, require strong passwords, and control which apps can even access company data.
Common Mistake: Underestimating how vulnerable mobile devices are. Your field team’s phones and tablets are a much softer target than your internal network. Ignoring mobile-specific security threats is asking for trouble.
7. Establish Performance Monitoring and Iterative Improvement
You’re not finished when the dashboards go live. That’s actually when the real work begins. You need a continuous improvement cycle. Set up clear metrics to judge if the dashboards are even working. Is unplanned downtime actually going down? Are your maintenance costs dropping? Are people making better decisions? You have to track user adoption and constantly gather feedback through surveys or just by talking to people. This feedback loop is everything. If users say a chart is confusing or an alert fires too often, you have to fix it. Most platforms provide analytics on dashboard usage, so you can see which reports are popular and which are being ignored. Use that data to refine what you’re showing people. Set up a quarterly review with key stakeholders to make sure the dashboards are still aligned with the company’s goals. Your operational needs will change, and your dashboards have to change with them to stay useful.
Pro Tip: Create a small “Dashboard Governance Committee” with people from IT, operations, and leadership. This group can own the strategic direction, prioritize new features, and make sure the dashboards don’t become stale.
Common Mistake: Launching the dashboard and calling the project done. Without constant monitoring and improvement, a dashboard quickly becomes outdated, ignored, and useless as a decision-making tool.
Getting mobile AI dashboards in place genuinely changes how a company sees and manages its physical assets. When you properly define what you need, integrate your messy data, apply smart AI, and build for the actual users, you gain a level of control and transparency that was impossible before. This lets you make faster, smarter decisions that directly lead to better efficiency, lower costs, and a much stronger position in your market.
What is the primary benefit of using mobile AI dashboards for asset visibility?
The main benefit is getting real-time, actionable intel delivered straight to the phones of decision-makers and field staff. This allows for proactive maintenance and immediate response to problems which cuts downtime and makes operations more efficient.
How do AI capabilities enhance traditional asset monitoring dashboards?
AI, specifically machine learning for anomaly detection and prediction, goes way beyond simple alerts. Instead of just flagging when a temperature is too high, AI models can spot complex patterns across many data points that signal a future failure, giving you a heads-up before something breaks.
What types of data are typically integrated into these mobile dashboards?
You’re usually pulling data from everywhere: SCADA systems, IoT sensors (tracking temperature, vibration, etc.), ERP systems (for asset history), and your Computerized Maintenance Management System (CMMS). Sometimes you’ll even pull in external data like weather or traffic for logistics planning.
Is it necessary to have a dedicated mobile app, or can a web-based dashboard suffice?
While a web dashboard works on a phone’s browser, a dedicated native app is almost always better. You get a much smoother user experience, offline access, use of the phone’s camera or GPS, better performance, and tighter security. For anything mission-critical, a native app is the way to go.
What are the key security considerations for mobile AI dashboards?
Security is huge. You need multi-factor authentication (MFA), full data encryption (on the device and over the network), role-based access controls to limit who sees what, and a way to manage the devices themselves (like an EMM solution). Regular security audits are also a must to protect your operational data.