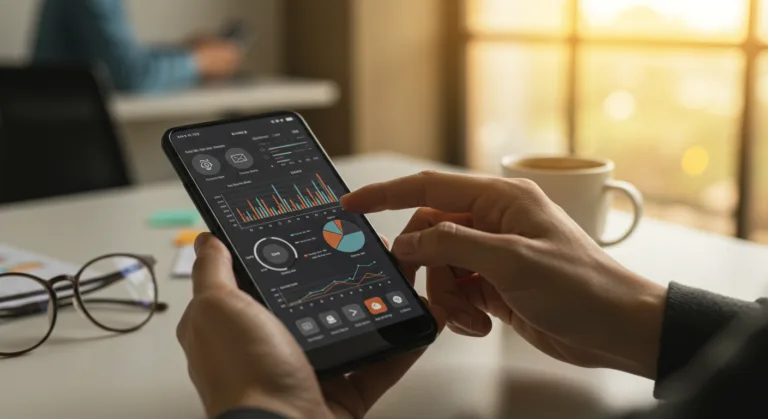
By 2026, if you were in the mobile app business, you were feeling the heat. Take “AquaFlow,” a small smart-home startup out of Austin that made water conservation devices. Their app was supposed to be the brains of the operation, monitoring usage, detecting leaks, but it was failing badly at keeping users around. They got plenty of downloads, but after a week, people just stopped opening the app. The core problem was a lack of mobile telemetry, meaning AquaFlow was completely in the dark about actual user behavior. They had no way to know why people were installing the app and then vanishing, so how could they fix anything?
Key Takeaways
- Get a mobile telemetry solution in place from day one of development so you can capture real user interaction data right from the first launch.
- Zero in on specific user flows for data collection, like onboarding or adopting a new feature, so you can find exactly where the friction is.
- Run A/B tests based on what your telemetry is telling you to prove your UX improvement ideas actually work and to measure their effect on engagement.
- Add in-app surveys and other qualitative feedback to get the story behind the numbers and understand the “why” of user actions.
- Constantly check your telemetry data to make sure it’s accurate and compliant with privacy laws like GDPR, because those rules are always changing.
AquaFlow’s Blind Spot: The Initial Engagement Gap
Sarah Chen, AquaFlow’s CEO, still sounds frustrated when she talks about those early days. “We thought we’d built an intuitive app,” she said at an SXSW Interactive panel. “Marketing crushed the initial download numbers. But then… nothing. A black hole. We could see the installs, but we couldn’t see what anyone was doing inside the app.” This total blindness to user behavior turned every product meeting into a session of pure guesswork. Maybe the onboarding was too hard? Or maybe the leak detection was confusing? Without any real data, every idea for a fix was just a shot in the dark.
The analytics platform they were using was pretty basic, giving them just the big picture numbers like total active users, session length, and crash reports. Those numbers gave them a 30,000-foot view but missed all the small interactions that make or break an app experience. They knew, for example, that people were giving up during setup, but they had no clue where in the setup process, nor why. Did they get stuck connecting to Wi-Fi? Was it the device pairing? Or was it the screen where they had to identify their water fixtures? Each of those problems requires a completely different fix, and throwing dev time at a guess is just burning money.
To make things worse, the smart-home market was getting crowded fast, and a good user experience was quickly becoming the only way to stand out. A clunky, confusing app was a death sentence. Users would just delete it and go find a competitor that worked better. “Our first funding review was three months away,” Sarah admitted. “We were in real trouble if we couldn’t turn our engagement numbers around.”
Implementing Granular Mobile Telemetry: A Strategic Shift
With the clock ticking, AquaFlow brought in a mobile analytics consultancy. The advice was simple: they needed a real mobile telemetry system. This meant strategically instrumenting the app to capture specific, useful data from every important user interaction. The whole point was to map out the entire user journey in detail, from the second they opened the app to setting it up and using it every day.
The consultancy laid out a plan in phases, starting with the onboarding flow because it was bleeding users. This first phase involved instrumenting every single button tap, screen view, and input field during device pairing and account creation. They tracked things like when a user started the “Add Device” flow, how long they lingered on each screen, if they hit any errors during the Wi-Fi setup, and whether they actually finished by naming the device. They also started tracking permission requests to see if users were granting Bluetooth or location access and at what point they were saying no.
A couple of key tools they put in place were Google Analytics for Firebase, which they set up with custom events for AquaFlow’s specific flows, and Mixpanel. The Firebase setup let them log detailed actions and tie them to specific screens with custom parameters (like the type of water fixture). Mixpanel was essential for its funnel analysis, which let them visualize exactly where users were dropping out of a multi-step process like setup.
| Feature | AquaFlow’s Initial Analytics Platform | AquaFlow’s New Telemetry System (Google Analytics for Firebase) | AquaFlow’s New Telemetry System (Mixpanel) |
|---|---|---|---|
| Granular User Interaction Data | ✗ No (only high-level metrics) | ✓ Yes (custom events, detailed logging) | ✓ Yes (funnel analysis, pinpoint drop-offs) |
| Identifies Micro-Interactions | ✗ No | ✓ Yes (button taps, screen views, input fields) | ✓ Yes (user progression through multi-step processes) |
| Pinpoints Setup Friction | ✗ No (only abandonment during setup) | ✓ Yes (tracks Wi-Fi setup errors, device naming) | ✓ Yes (visualizes user progression, exact drop-off points) |
| Correlates Actions to Screens | ✗ No | ✓ Yes (links user actions to specific screens) | Partial (focuses on funnels) |
| Tracks Custom Parameters | ✗ No | ✓ Yes (like type of water fixture) | Partial (can use properties in funnels) |
| Provides Funnel Analysis | ✗ No | Partial (can build basic funnels) | ✓ Yes (powerful capabilities) |
Uncovering the Friction Points: Data-Driven Discoveries
The new telemetry system started sending back data almost immediately, and it wasn’t pretty. The biggest surprise came from the device pairing flow. The team had bet money that the Wi-Fi connection was the problem, a classic smart-home headache. But the data showed something else entirely. A huge number of users, over 40% in early 2026, were bailing on the “Select Your Device Type” screen. This was the screen with pictures of the different AquaFlow sensors. People were just sitting there, tapping back and forth between the images, and then finally giving up and closing the app.
Digging deeper by connecting the screen view data with error logs and uninstall events proved this was the main bottleneck. The team’s first guess was that the images were confusing and people couldn’t find their device. But combining different data sources gave them the real answer. They set up little in-app surveys to pop up for anyone who was stuck on that screen for more than 30 seconds. The responses were eye-opening: people weren’t confused about which device they had, they were confused about what to do next. They didn’t know if tapping the picture selected it or just opened a help page.
This is exactly the kind of design flaw that high-level metrics will always miss. The fix ended up being pretty simple. They just added a big “Confirm Selection” button under the images and a little animation pointing to it. They A/B tested the change, of course, using their new telemetry setup to watch the results. Within two weeks, the version with the button had a 25% higher completion rate for that step, a clear win they could measure directly.
Beyond Onboarding: Refining Core Features
Once they fixed the onboarding mess, AquaFlow pointed its telemetry tools at the app’s core features, especially the leak detection and water usage reports. They needed to know if people were using the daily dashboard and, more importantly, if they were setting up custom alerts for strange water usage patterns. The data showed that lots of people looked at the graphs, but almost nobody was setting up alerts. This was a huge miss, since those proactive alerts were one of the main reasons to buy an AquaFlow device in the first place.
It turned out the alert configuration screen was buried three levels deep in the settings menu. Functionally it was fine, but users just weren’t finding it. The team tried putting a big “Set Up Alerts” button right on the main dashboard and A/B tested different placements and text. The results were immediate: telemetry showed a 15% jump in users getting to the config screen and a 10% lift in alerts actually being created within a month. This one small tweak led to users who set up alerts reporting much higher satisfaction in feedback surveys and also spending more time in the app per session.
They also noticed something interesting in the “Historical Data” section. People checked their daily and weekly usage all the time, but almost no one looked at monthly or yearly trends. This told the team that users either didn’t see the point or found the long-term data hard to understand. So, the product team started brainstorming better ways to visualize that data, like showing total money saved over a year or pointing out seasonal patterns. Every idea would be guided by what they were already seeing in the telemetry and then validated with more A/B tests.
The Business Impact: A Story of Revival
AquaFlow’s turnaround is a perfect case study in what good data collection can do for a business. When the funding review rolled around, Sarah Chen didn’t just have a good story to tell. She had hard numbers to back it up. She showed them how average onboarding time was down by 30% and how the number of people using core features was up 20% in just three months. Those numbers, which came directly from their new telemetry, were enough to get the investors to sign on the dotted line. AquaFlow got its next funding round and could finally grow.
“We stopped guessing and started making data-backed decisions,” Sarah said in a press release. “We were finally able to understand our users on a fundamental level, which let us anticipate what they needed and improve their experience before they even complained. Without that granular data, we’d still be building features in a vacuum and just hoping for the best.”
Any app team can learn from what happened at AquaFlow. Investing in good mobile telemetry isn’t just a nice-to-have. You absolutely need it to understand your users, keep them engaged, and prevent them from churning. It gives you the proof you need to stop making assumptions and start building a product people actually want to use. Sure, it costs money to collect good data, but the cost of flying blind is way higher.
The Future of Mobile Telemetry: Beyond Basic Metrics
Mobile telemetry is getting more sophisticated as we head past 2026. The focus is shifting to behavioral analytics that try to figure out the *why* behind user actions, not just the *what*. This means using machine learning models to spot patterns that predict when a user is about to churn or identify who your power users are. For instance, you can use anomaly detection on your telemetry stream to get an automatic alert when engagement suddenly tanks after an update, flagging a problem with a new feature before it gets out of hand.
Of course, privacy laws like GDPR and CCPA are a huge factor in how we collect and use this data. Your telemetry system has to be built with privacy in mind from the start, with clear consent pop-ups and good anonymization. We’re also seeing more teams move to server-side tracking for some events because it gives you more control and isn’t as easily blocked by ad blockers. It’s a complicated part of the job that requires constant attention from both devs and PMs.
We’re also getting better at mixing qualitative feedback right into our telemetry pipelines. Think about it: a user is clearly struggling with a feature, and your system automatically triggers a quick, targeted survey asking what’s wrong. Combining the “what” from your telemetry with the “why” from that survey creates a fantastic feedback loop for making the product better. We’ve moved way beyond just counting clicks. The job now is to understand the complete digital body language of your users.
The goal of mobile telemetry has always been straightforward: to give you clear, useful insights into how people actually use your application. For a company like AquaFlow, this was the difference between going out of business and securing their next funding round. For any app developer out there, it’s the compass that guides product evolution when the competition is fierce.
If you want to build a successful mobile app in 2026, you can’t treat understanding user behavior through effective mobile telemetry as a luxury. It’s a basic requirement. Instrument your app from the beginning, track the user journeys that actually matter, and let the data show you what to build next.
What is mobile telemetry?
It’s the process of collecting detailed data about everything a user does inside your app. This means tracking things like which screens they view, what buttons they tap, what they type into fields, and where they run into errors. The whole point is to get a deep understanding of user behavior and how the app is performing.
Why is granular user behavior data important for mobile apps?
This level of detail is essential because it shows you exactly where users are getting stuck, giving up, or getting confused by a feature. High-level numbers like “daily active users” don’t tell you that. This detailed data lets you make specific fixes to the user experience, which directly improves engagement and retention.
What are some common tools used for mobile telemetry?
Common choices include Google Analytics for Firebase, Mixpanel, Amplitude, and Branch. Each one offers a different mix of tools for things like event tracking, funnel analysis (seeing where users drop off in a process), user segmentation, and crash reporting to help you make sense of all the data.
How does mobile telemetry help improve app retention?
It helps you improve retention by showing you exactly what’s frustrating your users. When you can see the specific screen where people are dropping off, you can fix it. Making the app less frustrating and more intuitive makes people want to stick around and keep using it.
What are the privacy considerations for collecting mobile telemetry data?
You absolutely have to follow privacy laws like GDPR and CCPA. That means getting clear consent from users before you track anything, being transparent about what you’re collecting and why, anonymizing data when you can, and giving users a way to see and delete their data. You have to build your app with privacy as a core feature, not an afterthought.