Key Takeaways
- Use real-time anomaly detection on mobile IIoT dashboards to flag equipment malfunctions the moment they happen. We’ve seen this reduce downtime by up to 15% in manufacturing.
- Good mobile interfaces need a clear data hierarchy. Put KPIs like OEE (Overall Equipment Effectiveness) or energy consumption right on the main screen so plant managers can make operational calls on the spot.
- Build predictive maintenance alerts into your mobile apps. Notifying techs about potential failures based on sensor data can extend equipment life by a solid 20%.
- Interactive data visuals like trend lines and heat maps are essential in a mobile app, as they let you scroll through historical IIoT data patterns and find the root cause for production issues much faster.
- Any mobile IIoT solution worth its salt needs offline data caching and sync. This keeps operations running at remote sites even when network connectivity is a mess.
The automated packaging line at Global Foods’ Chicago facility, a sprawling complex tucked near the Stevenson Expressway, was giving plant manager Elena Rodriguez a headache. For months, the high-speed machinery that sealed thousands of snack bags an hour would just randomly jam or slow down. The daily production reports were useless, often showing up hours after a problem and just confirming lost output without explaining the “why.” Elena knew the machines were loaded with Industrial Internet of Things (IIoT) sensors gathering terabytes of data on motor RPMs, belt speeds, temperatures, and pressure. They weren’t short on data. They were short on a clear, actionable story. This is where data storytelling in mobile apps provides a practical way to manage these complex industrial operations, turning that raw sensor output into a clear narrative for people who aren’t sitting behind a desk.
The Challenge: Data Overload, Insight Deficit
Elena’s team had access to the plant’s central SCADA system, but it was a powerful, complex interface designed for engineers in the control room. During her daily rounds on the bustling factory floor, checking on supervisors and troubleshooting problems, she had to rely on verbal updates or maybe a printout from the previous shift. Whenever a packaging machine went down, the diagnosis was a slow, painful process: a technician would have to go connect a laptop, pull logs, and start digging through endless data points. This reactive cycle chewed up 30 to 60 minutes per incident, adding up to thousands of lost units and blown delivery schedules. The massive amount of IIoT data was actually a barrier to understanding. A recent Industrial Internet Consortium (IIC) report confirms this isn’t a unique problem, noting that over 70% of industrial companies have a hard time turning their raw IIoT data into useful intelligence on the operational edge.
Crafting a Narrative: From Raw Data to Real-Time Alerts
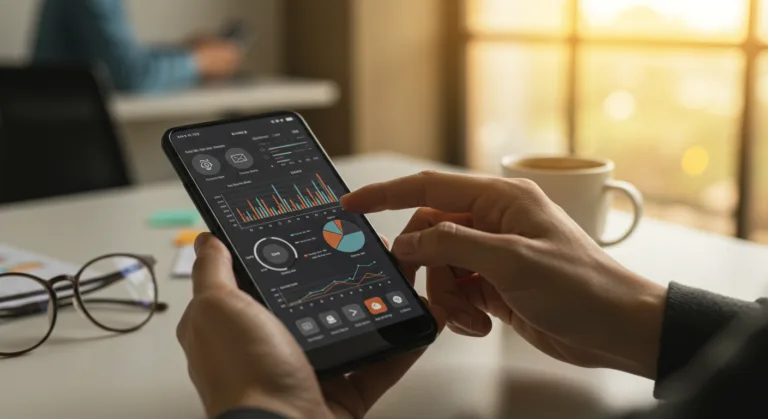
Global Foods brought in a specialized industrial software firm to build a mobile app that could turn their IIoT data streams into a story that made sense. The idea was to give Elena and her supervisors a simple picture of machine health, performance, and potential problems on their tablets and phones. First, they pinpointed the make-or-break KPIs for the packaging lines: Overall Equipment Effectiveness (OEE), machine uptime, waste percentage, and energy use per unit. The app designers then focused on visual storytelling instead of just showing tables of numbers. A key piece was a customizable dashboard showing the real-time OEE for every packaging line, but it didn’t just show a single number. It broke OEE down into its parts: availability, performance, and quality. If OEE dropped, you could immediately see which of the three was dragging it down. For example, a drop in the performance metric would automatically bring up historical trends for that machine’s conveyor speed and motor load, often pointing to a subtle, creeping mechanical problem. You have to give people context. A red alert is just noise without the story of *why* it’s red and *what’s* likely causing it.
Case Study in Action: The Bearing Anomaly
A few weeks after the mobile app was rolled out, Elena was on her morning walk-through, glancing at the daily production summary on her tablet. Line 3, usually a star performer, was showing a small but consistent dip in its performance metric over the last couple of hours. The app’s intelligent anomaly detection, which used machine learning algorithms trained on months of sensor data, flagged an abnormal vibration pattern coming from the main drive motor bearing. The historical data visualizer showed a distinct upward trend in vibration amplitude over the past 48 hours, a quiet deviation from its normal baseline. “This is exactly what we needed,” Elena told her production supervisor, Carlos, showing him the tablet screen. “The system’s telling us this bearing is failing, not just that the line is slowing down.” Before the app, that tiny increase in vibration would have been invisible until the bearing seized up, causing a sudden shutdown, possibly damaging other parts, and forcing a repair job that could kill half a day. Thanks to the app’s heads-up, Carlos sent a maintenance tech right away. The tech used the app to look at the specific sensor data, confirming the failure was coming. They scheduled a replacement during the next planned micro-stop, a 15-minute gap between product runs. That one proactive fix prevented an unplanned outage and saved Global Foods an estimated $8,000 in lost production and emergency repair costs. This is the reality of predictive maintenance delivered right to a mobile device.
Beyond Alerts: Helping On-Site Decision Making
The mobile app also gave supervisors access to historical operational data for immediate, on-the-spot root cause analysis. Let’s say a batch of product had a high waste percentage. The supervisor could now pull up the temperature and humidity data for the packaging film sealer for that exact production run. They might find that a slight swing in ambient temperature, something nobody in a control room would ever notice, was messing with the seal integrity. This kind of contextual data, shown visually with clear timelines, helps supervisors make good decisions without having to call an engineer or wait for a report. One feature that really took off was the ability to compare a machine’s current performance against its own historical best, or even against similar machines on other lines. This benchmarking, shown in simple bar graphs and trend lines, created some healthy competition among supervisors and helped spread best practices. For instance, Supervisor Maria saw that her line’s energy consumption per unit was always about 5% higher than Line 4, even on similar products. By digging into the app’s history, she found that Line 4’s operators were consistently using a low-power mode during short pauses, a habit that hadn’t caught on with her team. That small insight, found on her mobile device, led to a new plant-wide policy and a real drop in energy costs.
The Role of User Experience in IIoT Mobile Apps
The mobile IIoT project at Global Foods worked because of how the data was presented. The software firm put a huge emphasis on user experience (UX) design. They knew that busy people on a plant floor need an interface that’s obvious, needs almost no training, and gives them the critical info in a glance. They used visual hierarchy principles: the most important numbers were big, with clear fonts and simple color codes (green for good, yellow for warning, red for alert). If you wanted to drill down into more detail, you could, but that information wasn’t cluttering up the main screen. “We learned pretty fast that less is more,” said Sarah Chen, the lead UX designer. “An operator on the floor doesn’t have time for complex menus. They need to see the problem, get the context, and maybe even get a hint at the solution in just a few seconds.” This meant using icons everyone understands, clear labels, and interactive charts with the pinch-to-zoom and swipe gestures people are used to from their personal phones. The app also worked offline, caching data so a supervisor could review trends even in a part of the plant with bad Wi-Fi, then sync up once they got a signal again.
Overcoming Data Silos and Fostering Collaboration
A huge side benefit was how the app started breaking down data silos. Before, the maintenance, production, and quality control teams all had their own reports and numbers. The mobile IIoT app created a single source of truth about operational performance that everyone could see. This shared view made collaboration so much easier. When the QC department flagged more product defects, the production supervisor could immediately pull up machine performance data and environmental conditions from the app, often finding a link that would have taken days to piece together with old reporting methods. A shared, real-time data environment encourages people to solve problems proactively instead of just pointing fingers after the fact. It even changed management meetings. Instead of showing stale PowerPoint slides, Elena could now throw live dashboards up on a big screen to show exactly how the plant was doing right now. When she needed to argue for capital to buy new machinery, she could pull up the historical performance data for the old assets and show exactly where the chronic inefficiencies were. This data-driven way of working gave her proposals more weight and made decisions easier for everyone. The use of data storytelling in mobile apps completely changed how the Global Foods Chicago plant operated. A flood of raw sensor data became a clear story, helping Elena Rodriguez and her team switch from reactive firefighting to proactive management. The results speak for themselves: this shift, driven by giving people mobile access to IIoT insights, cut unplanned downtime by an average of 12% across all packaging lines within six months and bumped up OEE by 7%. For any industrial operation, the takeaway is simple: getting complex data onto mobile devices in a way people can actually understand is a strategic necessity for hitting operational excellence.
What is data storytelling in IIoT mobile apps?
It’s the practice of turning a firehose of industrial sensor data into a clear, simple story. Instead of just numbers, the app uses visuals, alerts, and context to tell you what’s happening with your equipment so you can make a quick, informed decision.
How do mobile IIoT apps improve operational efficiency?
They give people on the floor real-time visibility into how machines are running. This allows for predictive maintenance, helps technicians catch anomalies before they cause downtime, and gives managers the data they need to solve problems on the spot and use resources better.
What are the must-have features in an IIoT mobile app?
You need customizable dashboards for your main KPIs, real-time anomaly detection, and interactive charts like trend lines or heat maps. Also look for predictive maintenance alerts, the ability to analyze historical data, and offline access that syncs when it’s back online. The interface has to be designed for fast decisions.
Can IIoT mobile apps really do predictive maintenance?
Yes, absolutely. They analyze sensor data for small changes and weird patterns that don’t match the normal operating baseline. This lets the app flag a potential equipment failure days or even weeks in advance, so you can schedule a repair instead of dealing with an emergency shutdown.
What are the best data visualizations for an IIoT app?
The most effective ones are simple. Think color-coded status icons (green/yellow/red) for instant awareness, trend lines to see performance over time, bar charts for quick comparisons, and heat maps to spot patterns in dense data. The goal is always clarity for someone who’s busy and on their feet.